(cont. from part 2)
7. REQUIREMENTS FOR IMPLEMENTING THE SYSTEM
Generally, the tramway system is selected as a means of transport
• When there is relatively low demand for travel (=10,000-15,000 passengers/h/direction).
• When it is sought to regenerate/upgrade an area and, generally, when it is desired to maintain the activities of an area.
• For cities facing a specific air pollution problem.
• When there is high demand for travel (>10,000 passengers/h/direction) and the subsoil or the lack of funding prevents the implementation of an underground solution.
The tram is the only urban public transport mode which results in the active removal of private cars from the areas through which it passes, with concurrent satisfaction of the demand. This is mainly achieved by integrating the tramway system across existing roads, thereby substantially reducing the street parking spaces for private cars.
Implementing a tramway system is politically the easiest way to 'claim' a dedicated lane for public transport in the urban space. Also, it is easier to make decisions regarding pedestrianizations in cities which feature a tramway system.
========

FIG. 30 Stages of a tramway system design study.
-------
Analysis of features of the transport system and the urban environment; Analysis of transport and urban development policies; Scope and objectives of the tramway project; Preselection of alternative tramway alignments; Selection of the 2-3 alignments with the highest ranking; Multicriteria analysis for the evaluation of preselected alignments; Applicability verification of the selected alignments; Conventional cost-benefit analysis; Generalized cost-benefit analysis; Selection of the proposed tramway alignment; Implementation study 4th stage (feasibility studies) 3rd stage (preliminary design) 2nd stage (evaluation and selection) 1st stage 5th stage (final design)
-------
========
8. APPLICABILITY VERIFICATION OF ALTERNATIVE ALIGNMENTS
FIG. 30 presents the successive stages of a tramway project study. More specifically, in the first stage, alternative alignments are identified and preselected, according to the objectives and prerequisites set by the contracting authority, such as the starting and ending points of the alignment, the areas to be served, the accomplishment of the priorities for future sustainable mobility etc. The number of these preselected alignments is usually high (more than five alternative alignments).
At the second stage, the aforementioned alternative alignments are evaluated, and those with the highest potential (usually 2 or 3 of them) qualify for the subsequent stages of study. The attained evaluation process can be performed by means of a multi-criteria analysis.
The third stage focuses on the applicability verification of the alignments that received the highest score during the multi-criteria evaluation. The applicability verification is a special stage in the implementation studies of urban and suburban rail networks. It has the same weight and importance as a preliminary track alignment study and a prefeasibility study. It formulates feasible solutions while at the same time it produces the constructional, operational and financial data of the system which are essential for the final studies.
In particular, it is essential that the 2-3 selected alignments satisfy the following conditions:
• Is the geometrical insertion of the alignments feasible?
• Do they ensure an adequate level of service to the users (low travel time, frequent service)?
• Can their possible negative impacts on the other transport modes be overcome in an effective and low-cost way?
• Do they create negative environmental impacts on the area of influence, which may be prohibitive for the implementation of the tramway project?
• Is there space availability for the construction and efficient operation of rolling stock parking, maintenance and repair facilities (depot)?
• Does the preliminary estimation of the cost of the tramway project in accordance with the international practice (average cost per track kilometer)?
The satisfaction of the above conditions pre-requires, for each alternative alignment, the applicability verifications illustrated in FIG. 31 which must be satisfied simultaneously.
These applicability verifications may introduce minor or major modifications to the initial design.
At the fourth stage, the feasibility study of the qualified alignments is conducted, using two approaches: (a) the conventional cost-benefit analysis which evaluates the net financial benefits expected to derive in a predefined time horizon and (b) the generalized cost-benefit analysis which evaluates the additional monetary values of the expected socioeconomic, environmental and land use benefits and costs.
The fifth stage pertains to all the other studies required for the final implementation of a tramway project.
8.1 Verification of track alignment and geometric integration
During this verification, the designers, having shortlisted a potential alignment of the tram way network, check whether
a. The alignment is acceptable both for the horizontal and the vertical.
b. Along the transit zone, there is adequate space for the integration of the tramway infrastructure and for the movement of pedestrians and road vehicles, with a level of service that is considered acceptable.
FIG. 32 presents a logical diagram of the steps that designers follow during the pro cess of the applicability verification of the track alignment and geometric integration.
===============
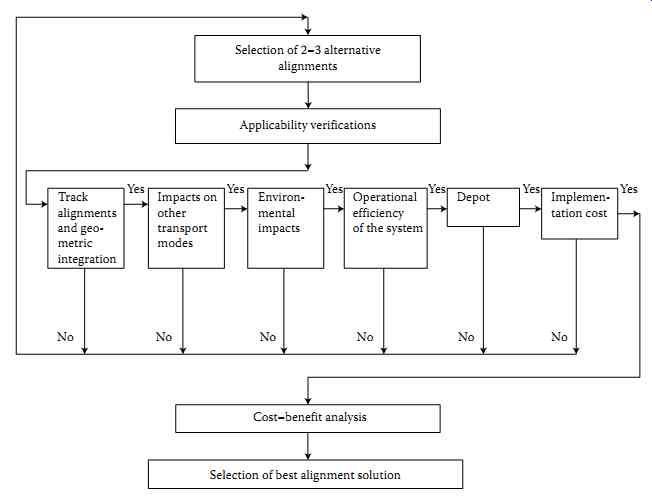
FIG. 31 Logical diagram of alternative tramway alignments acceptance.
Applicability verifications.
===============
As can be seen from FIG. 32, while carrying out this verification, two individual verifications are conducted in chronological order, namely
1. Track alignment verification: At this stage, it is checked whether the track alignment allows, horizontally and vertically, the running of trams. More specifically, the radius of curvature in the horizontal alignment Rc, the gradient i in the vertical alignment, and the height clearance h under the civil engineering structures are checked. For the verification of the above parameters, their calculation along the entire network and the comparison of their values to the minimum/maximum permitted values are required. If the verification is satisfied for all parameters, the designers proceed to the verification of the geometric integration.
2. Geometric integration verification: At this stage, and having…
• Preselected the category of tramway corridor for each road artery (classes A, B, C, D, E)
• Preselected the final integration type of the tramway tracks
• Preselected the vehicle height
• Selected the integration type of tramway stops
• Selected the power supply system and, in the case of electrification, the type of integration of the overhead wires
• Selected the width and length of the vehicle

FIG. 32 Verification of the design and geometric integration of alternative
tramway alignment.
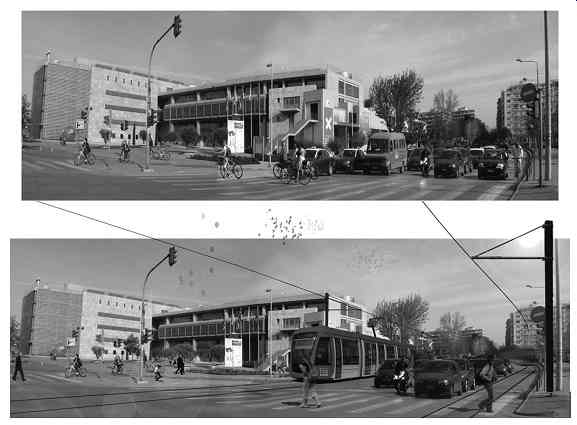
FIG. 33 Example of the current layout and the new layout for a road before
and after the integration of a tramway system-Queen Olga Street, Thessaloniki,
Greece.
The technical and total tramway infrastructure right-of-way are calculated
• For straight paths as well as for the areas of stops with the aid of mathematical expressions (eqn.1 through 11)
• For turns, with the aid of design simulation In order to enable the geometric integration of tram lines in the straight paths as well as in the areas of stops, the total right-of-way should be less than the available road width.
In order to enable the geometric integration of tram lines in curves, even with the smallest allowable radius of 25 m, the two intersecting roads should have the available width.
The current cross sections are then designed at strategic locations of the alignment, and the condition of the road is recorded concerning the circulation of road vehicles and pedestrians before the integration of the tramway system.
Finally, the new cross sections are designed at the above mentioned locations, taking into account the integration of the tramway system.
If the new situation is not acceptable (e.g., inadequate width of sidewalks, inadequate width or inadequate number of traffic lanes), then intervention is required for the modification of one or more of the above initial selections in order to achieve an acceptable geometric integration. In the case where the new situation, arising after the integration of the tramway system, is acceptable, then the designers proceed to conducting the next applicability verification for the alignment that is under examination.
FIG. 33 and its attached table illustrate an example of the current layout and the new layout for a road before and after the integration of a tramway system (placement of a single tramway track at two opposite sides of the roadway).
where TT: single tramway track
?: direction of road traffic.
8.2 Verification of impact on other transport modes
The impacts that can arise from the integration of a tramway system in an urban area mainly involve
• The traffic of road vehicles
• Parking (reduction of on-street parking spaces)
• Service of roadside land uses
• Pedestrian movement (decrease of the sidewalk width, crossings)
• The operation of public transport modes (PT)
FIG. 34 illustrates a logical diagram which ensures that the possible negative impacts on other transportation modes arising from the integration and operation of the tramway system in regard to urban area can be removed or limited to acceptable levels.
The assessment of the new traffic conditions for the road network is usually conducted with the assessment of the trip origin-destination matrice, and its assignment on the net work that is being examined with the aid of an appropriate mathematical simulation model.
At the same time, it is necessary to record the removed (and therefore eliminated) parking spaces, and to explore how and where they can be recreated.
8.2.1 Roadside land uses
The impact from the integration of the alignment that is being examined in relation to the service of roadside land uses is considered
• Basing on the service requirements of specific land use categories and, particularly, the service of commercial uses by feeding vehicles and
• Basing on the access to specific uses (such as hospitals, sport facilities, exhibition and convention centers and educational institutions)
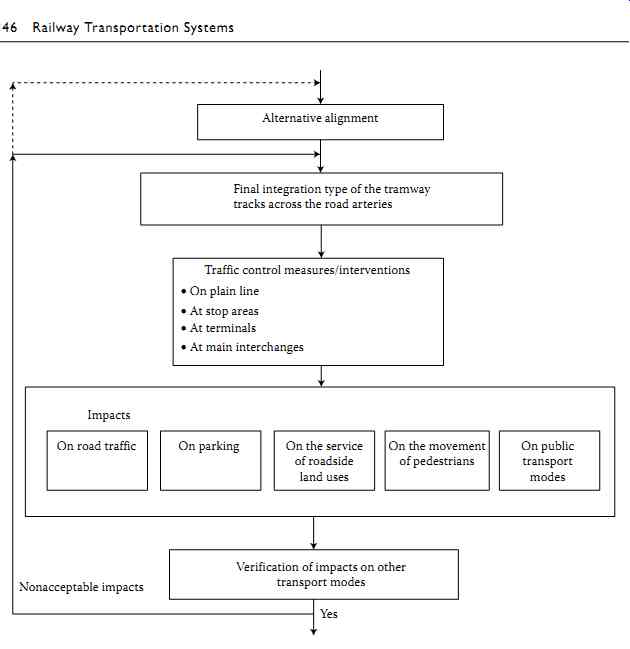
FIG. 34 Applicability verification concerning the impacts resulting from the
integration and operation of a tramway system on other transport modes.
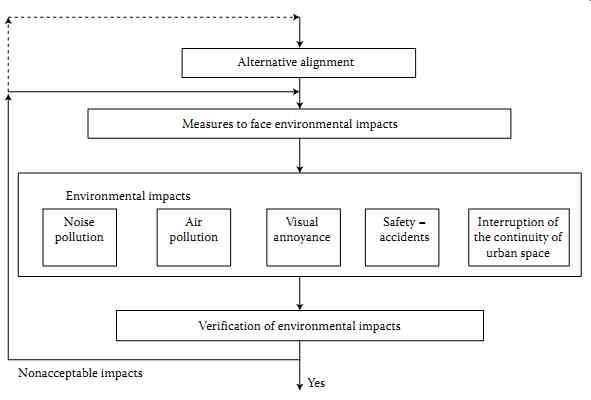
FIG. 35 Applicability verification concerning the environmental impacts resulting
from the integration and operation of the tramway system.
8.2.2 Pedestrians
The pedestrian network in the study area is favored by the integration of a tramway system for three main reasons: (a) roads are rearranged in terms of traffic and parking improvements which results in the improvement of pedestrian safety and of the mobility conditions for vulnerable users, (b) the pedestrian areas surrounding the tram are environ mentally upgraded and (c) the crossing of streets at unprotected locations is averted due to the existence of the tramway track superstructure (protected crossings are foreseen). Furthermore, the combined use of walking and tram enhances pedestrian flows in areas of interest, such as the historic and commercial center of the city, the services and the recreation areas.
The operation of the tram generally does not impede cycling; on the contrary, the replacement of part of the polluting road traffic by a tramway system which is environmentally friendly, upgrades the conditions for cyclists and promotes cycling.
8.2.3 Operation of other public transport modes
The integration of a tramway system in an urban area requires a study for the restructuring of the timetables and scheduled services of bus lines. This parameter is of great importance as often different operators with conflicting interests are involved.
8.2.4 Road traffic
The impacts on the road width that is available for the movement of motor vehicles along the roads on which the tramway system is integrated can be distinguished as of interest, such as the historic and commercial center of the city, the services and the recreation areas.
The operation of the tram generally does not impede cycling; on the contrary, the replacement of part of the polluting road traffic by a tramway system which is environmentally friendly, upgrades the conditions for cyclists and promotes cycling.
8.2.3 Operation of other public transport modes
The integration of a tramway system in an urban area requires a study for the restructuring of the timetables and scheduled services of bus lines. This parameter is of great importance as often different operators with conflicting interests are involved.
8.2.4 Road traffic
The impacts on the road width that is available for the movement of motor vehicles along the roads on which the tramway system is integrated can be distinguished as…
• Limited impacts, that is, impacts which are not expected to cause significant changes in the existing operation of the roads and the service of road traffic
• Important impacts which affect the existing operation of roads
Another significant impact from the integration of a tramway system on the road traffic concerns the facilitating of certain turning movements and the direct access of road vehicles (passenger and feeding) to the adjacent land uses. In any case, all of the aforementioned impacts can be encountered by integrating the tramway system on a tramway corridor class E and, more importantly, by using appropriate signaling at intersections, and by ensuring the installation of adequate guidance and warning signage, both vertical and horizontal.
8.3 Verification of environmental impacts
The effects of a surface railway transport mode on the environment cannot be considered as negative. However, as such systems pass through densely populated areas, it is likely to increase the noise level, while at the same time their operation requires equipment (overhead wires, rails, masts, etc.) that can cause visual or general aesthetic problems. At the same time, their positive impacts on the urban environment and, generally, on the upgrading of the urban environment (e.g., reduction of air pollution, rehabilitation and regeneration of certain areas) cannot be ignored.
The main challenge during the verification of the environmental applicability is whether the designer considers these effects negligible compared to the functionality of the network, or sufficient enough to require a radical restructuring of the study and, therefore, the construction of the project. In the second case, an assessment of the problems and the possible countermeasures should be made in order for the integration of the tramway system to be smooth.
In summary, all of the above are illustrated within the logical diagram of FIG. 35.
8.3.1 Noise pollution
Noise is referred to as the main polluting factor of a tramway system. Noise produced by a tramway system can be due to (a) the overhead power supply (arc noise) and (b) the train movement (rolling noise and vibrations).
Rolling noise is the most significant disturbance, as it occurs on the wheel-rail contact surface and is due to the lateral and longitudinal creep forces, the guidance forces exerted on the contact surface of the inner rail and the wheel flange and the vertical dynamic loads, which generate the vibration. If the rails are positioned correctly with the appropriate provisions and vibration damping mechanisms, the passage of a tram causes less noise than any other transport mode, while vibration is limited to a minimum.
The impact of this noise is critical in case the tramway passes close to specific land uses, such as health facilities.
The estimation of the impact of noise pollution should be considered in conjunction with the limitation of noise due to the reduction of motorized traffic and the regulation of the traffic flow.
For the noise impact at critical areas, a special study is required as part of the design study of the alignment. When these critical facilities cannot function appropriately the interventions relating to noise reduction may involve
• Placement of the track on the side of the road that is opposite to the facility thereby increasing the distance between the facility and the noise source.
• Deployment of a floating slab of sufficient length (100 m) before and after the location of the facility.
• Use of noise barriers for parts of the alignment outside the main urban space.
• Regular and appropriate maintenance of the track and the vehicles.
• Resilient wheels.

FIG. 35 Applicability verification concerning the environmental impacts resulting
from the integration and operation of the tramway system.
8.3.2 Visual annoyance
The main parameter of visual annoyance related to the urban surface tramway system is the overhead catenaries. The aesthetic nuisance is important both in developed areas with a high population density and visitors, and in less developed areas, as they limit their attractiveness.
The aesthetic nuisance should be counterbalanced by the improvement of the urban environment due to the reduction of the number of road vehicles and, in particular, the reduction of congestion in central areas. In addition, in order to reduce the aesthetic degradation resulting from the use of overhead catenaries, an appropriate design should be applied which may reduce the exposure of any additional equipment, and may minimize the overhead infrastructure with the aid of planting and other aesthetic means.
Nowadays, free catenary power supply systems are in operation. These systems provide a technical solution to this problem, especially when the tram passes largely through the historic centers of major cities.
8.3.3 Impact on the urban space
The reorganization of road infrastructure and traffic through the development and operation of tramway systems and the relief of congestion enables redesigning of central areas, upgrading of the urban environment in deprived areas, and increasing the attractiveness in new urban areas.
8.3.4 Impact on safety
In the case of a non-segregated tramway corridor, the coexistence of tramway traffic with road traffic and pedestrians and other road users may result in accidents such as pedestrian entrainment or collisions with private cars, at a much higher frequency than the respective frequency of such accidents in the suburban or interurban railway. Cyclists comprise a particularly vulnerable user group, followed by pedestrians and motorbike riders. The problem is exacerbated as the death rate for the above user groups, when they are involved in an accident with a tram, is greater than the respective rate for accidents involving private cars.
Furthermore, the service of a large number of tramway users and their frequent movement to and from the stops/platforms, makes it more likely that they become involved in accidents such as falling off the platforms, getting trapped between two trams or between a tram and a road vehicle, entrainment by road vehicle in the course of their approach to the station/ platform or during their departure from it, etc.
Finally, level crossings are a crucial point of tramway network, both in terms of safety and in terms of operation. This is due to the fact that they constitute a conflict point with road traffic and pedestrians.
It should be noted that most accidents involving a tram take place in the first months of its operation, as private car drivers and pedestrians are not used to the integration of the tramway system within the city's transportation network. Basing on the international experience, despite the additional accidents caused by the tram, the total number of various transport modes (private cars, trams, bicycles and motorbikes) involved is less than before the integration of the tramway system, as a result from the reduction of vehicle kilometers run by road transport (private cars, bicycles and motorbikes).
8.3.5 Impact during construction
During the construction, various problems can be caused in the area; however, compared to the problems caused during the construction of a metro system, those problems are of a much smaller scale.
8.4 Applicability verification of operational efficiency
While carrying out this verification, the designers consider whether the alignment that is being examined is operational, emphasizing on the commercial speed of the tramway vehicles and the passenger transport volumes.
Therefore, as shown in FIG. 36, the verification of the system's operational efficiency includes three individual verifications, which are carried out in the following order:
- 1. Verification of the commercial speed
- 2. Verification of the passenger transport volumes
- 3. Verification of operating cost
8.4.1 Verification of commercial speed
While carrying out this verification, it is investigated whether the commercial speed Vc of the trams is considered satisfactory by the users.
This takes onto consideration the category of tramway corridor along every road artery and the total length of each corridor category and by preselecting:
• The intersections with roads where the tram will have priority at traffic signals
• An average distance between successive stops equal to 500 m
• An average waiting time at each stop equal to 20 sec
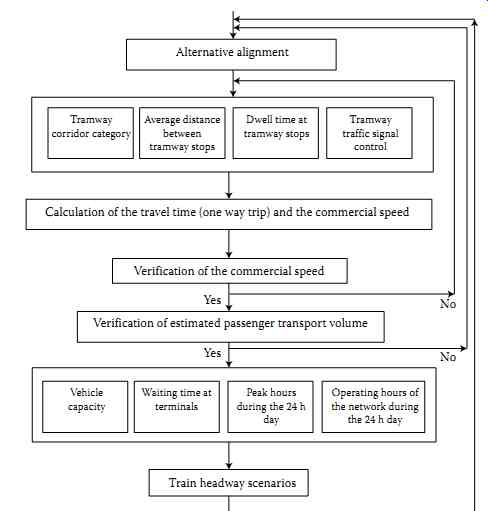
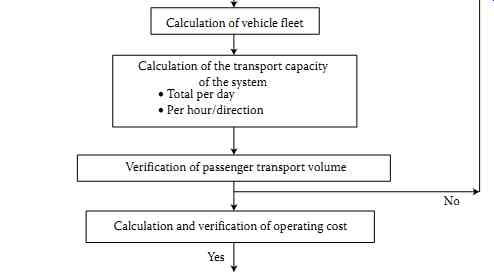
FIG. 36 Verification of operational efficiency.
the commercial speed Vc of the trams, and the travel time t, can be calculated .
=+ ++ + (eq.12)
V S t c = (eq.13)
where Vc: Commercial speed S: Total route length t: Total travel time SA, SB, SC, SD, SE: Tramway corridor length for corridor categories A, B, C, D, E, respectively VcA, VcB, VcC, VcD, VcE: Commercial speed of tramways running on corridor categories A, B, C, D, E, respectively ( Table 1).
If the resulting commercial speed is not within acceptable limits (typically 18-25 km/h) or a travel time which was initially set as a target is not met, the verification is repeated after modifying one or more of the above options (e.g., priority to tram at all traffic signals, change of the tramway corridor category). For example if priority is given to the tram at all signalized intersections, and if it is considered that this causes an increase in the commercial speed by 25%, the mathematical equation applies where VcB = 25 km/h and VcD = 22.5 km/h.
8.4.2 Verification of passenger transport volume
At this stage, two verifications are performed on the passenger transport volume, in the following order:
1. Verification of the estimated passenger transport volume (Pd): The daily estimated passenger transport volume is compared with the typical values of passenger transport volumes of similar passenger tramway systems as they are referred to in the international literature. The value of the estimated passenger transport volume Pd has been produced with the aid of traffic forecasting models.
The estimated passenger transport volume must meet the minimum volume requirements and document the need to investigate the feasibility of implementation of a tramway system in this area.
2. Verification of the transport capacity of the system: The daily passenger P'd volume that can be carried by the tramway system is compared with the estimated Pd value.
To calculate the capacity of the system, the values of the following parameters are initially selected:
• The transport capacity Cv of tramway vehicles.
• The waiting time tts of the trains at both terminals.
• The peak hours within the 24 h day.
• The duration of the network operating hours within the 24 h day.
Considering various scenarios regarding the headway between trains, the following parameters can be calculated:
- The required fleet of vehicles (including spare vehicles).
- The ridership that the system is capable of accommodating (total daily and total annual number of passengers/h/direction).
If the ridership that can be accommodated by the system is less than the estimated ridership, then designers modify one of the above parameters in an attempt to reach an acceptable solution for the passenger transport volume.
EXAMPLE
Total expected passenger volume per day per direction
• Pd = 25,000 passengers (optimistic scenario) Expected daily passenger volume per direction during peak hours
• Pdph = 4,000 passengers (optimistic scenario) Route length (AB) S = 10 km Total travel time tAB = 0.5 h = 30 min (Equation 12) Commercial speed Vc = 20 km/h (Equation 13) Waiting time of trams at each terminal station tts = 4 min Two-way route travel time (round trip + waiting time at the two terminal stations)
tABA = 2 × 30 + 2 × 4 = 68 min
Train transport capacity Cv = 200 passengers (150 standing and 50 seated - density 4 passengers/m^2 - during off-peak hours)
Train transport capacity Cvph = 275 passengers (225 standing and 50 seated - density 6 passengers/m^2 - during peak hours
The tram is considered operational from 05:30 to 00:30, that is, for a total of 19 h, while four of these operating hours are considered as peak hours.
Assuming a train headway for the operating hours during the off-peak period is equal to 10 min, a total of 68/10 = 6.8 = 7 'vehicles' are required to ensure the operation of the net work. This figure should be increased by:
• One replacement vehicle at the terminal or the tramway depot for the replacement of any vehicle that is damaged during operation.
• 12% (percentage of immobilized vehicles based on experience) of the estimated initial number of vehicles, namely one vehicle intended to replace any vehicle that is immobilized for repair or maintenance purposes at the tramway depot.
Therefore the total required fleet of vehicles for the service of the line during off-peak hours is marginally equal to nine (9) vehicles.
As regards the transport volume, the tramway system can carry in total ((200 passengers × 60 min)/10 min) × 15 h = 18,000 passengers per direction during the 15 off-peak hours of network operation.
Considering a train headway that is equal to 7 min during peak hours, a total number of 13 vehicles are required.
As regards the transport volume, the tramway system can carry in total ((275 passengers × 60 min)/7 min) × 4 h = 9,428 passengers per direction during the 4 peak hours of network operation.
Therefore, considering a train headway that is equal to 10 min during the off-peak hours and 7 min during the peak hours, a total number of 13 vehicles are required for the smooth operation of the system. The system is able to carry…
• 18,000 passengers per direction in total during the off-peak hours
• 9,428 passengers per direction in total during the peak hours (i.e. 2,357 passengers per hour) This results to a total of 54,856 passengers during the operating hours of the tramway network.
Therefore, the estimated passenger volume in an optimistic scenario (25,000 × 2 = 50,000 passengers) is satisfied.
8.4.3 Verification of operating cost (Kop)
While carrying out this individual verification, initially the operating cost of the network (cost of vehicles' circulation, cost of the power supply, track and rolling stock maintenance cost, cost for the operation and maintenance of fixed facilities, cost of infrastructure insurance, administration cost and other unforeseen costs) are calculated.
The resulting value of the cost is then divided by the estimated annual passenger volume, resulting in the operating cost per transported passenger, which is then com pared with the average value that is usually met in practice internationally (this value is around €0.8).
8.5 Applicability verification of a tramway depot
The applicability verification of a tramway depot is one of the most important verifications, as the depot is probably the most important structural element of the tramway system. As illustrated in FIG. 37, the applicability verification of the tramway depot includes four individual verifications which are performed simultaneously. These are
1. Verification of the required and the available tramway depot ground plan area: As part of this verification, initially the ground plan area that is required for the tramway depot, the lying of the tracks and other facilities, and the operation of the depot are calculated.
For the estimation of the required ground plan area, the methodology that was described in paragraph 6.3 can be applied.
The designers then compare the size of the area that is proposed for the location of the depot (available land) with the estimated required area.
2. Verification of the distance of the tramway depot from the tramway network ( verification of 'dead' mileage): As part of this verification, the designers calculate the distance between the point of entry to the area of the depot and the nearest terminal in order to assess the 'dead' kilometers.
The term 'dead' vehicle-kilometers describes the total vehicle-kilometers travelled by a vehicle without the production of any transport work. Therefore, the vehicle- kilometers to/from the depot are considered 'dead'. The nonproductive vehicle kilometers significantly affect the operating costs as their increase leads to an increase in energy consumption, the driving hours and rolling stock and track maintenance costs.
The entrances/exits of the tramway depot should be located as close as feasible to the network of the main tram traffic lines. The maximum permissible distance between the entrance of the depot and the nearest terminal is 2 km.
3. Verification of the topography of the terrain: As part of this verification the longitudinal gradients of the potential construction area of the tramway depot are examined and compared with the maximum permissible value. The soil must feature a gentle slope in longitudinal profile, so as to facilitate the laying of the tracks with the permissible maximum longitudinal gradient. It should be noted that construction-wise, it is feasible to achieve the desired parameters, however, this can significantly increase the construction cost.
Verification of the ability to acquire the land and locating of the tramway depot: As part of this verification, the qualitative parameters are examined, contrary to the three aforementioned individual verifications which related to quantitative parameters. More specifically, the following are considered:
• The possibility of obtaining an area for the construction of the tramway depot. Generally, areas that require the lowest cost of expropriation should be selected.
• The compatibility with adjacent land uses. If the land is located in an area with incompatible land uses (residential, entertainment, health), other areas must be sought or environmental interventions should be applied, which may increase the construction cost.
• The integration with the environment. The integration of the tramway depot within a 'sensitive' environment should be avoided. Generally, it should be possible to apply all necessary measures in order to minimize the environmental impacts at the catchment area of the tramway depot. Locating of the tramway depot at areas of archaeological interest should also be avoided.
FIG. 37 Applicability verification of a tramway depot.
8.6 Verification of implementation cost
The implementation cost comprises the construction cost of the infrastructure and the cost of acquiring the rolling stock.
The construction cost includes
• The cost of repairing the roads on which the tram is integrated
• The cost of relocating utility networks (gas, electricity, water, sewage)
• The construction cost of the subgrade
• The construction cost of the track superstructure
• The cost of equipment for tramway stops
• The cost of pedestrianization in exclusive tramway corridors (where provided)
• The construction cost of civil engineering works
• The construction cost of depots
• The cost of installation of the electrification system, the signaling system and the telecommunications system
• The cost of construction of the necessary buildings for the system's operation
• The cost of studies, supervision and management of the project
• The cost of measures to face environmental impacts
• The expropriations cost
The cost of the project must be similar to the cost which is referred to in international practice. The average construction cost of a tramway line (infrastructure and rolling stock) is calculated at €20-25 M per track-km (2014 data).
9. HISTORICAL OVERVIEW AND PRESENT SITUATION
9.1 Historical overview
The evolution of the trams consists of five distinct periods. The period of the horse-drawn tram, the transition period from horse power to electric power, the period of development of electric trams, the period of the dismantling of trams and, finally, the period of the reintegration of trams in the urban transportation systems.
9.1.1 The first horse-drawn tram
The first passenger tram in the world was the Swansea and Mumbles Railway in Wales which commenced operation in 1807 as a horse-drawn tram. From 1877 to 1929 this tram was powered by steam.
The first tramway lines were laid in the United States, specifically in Baltimore, in 1830, in New York in 1832 (New York-Charlem tram line), and in New Orleans in 1834 (the oldest tram network with continuous operation worldwide). In Europe, the first tramway line was laid in France, near St. Etienne, in 1838.
In 1853, the first tram with grooved rails commenced operation in the Broadway Avenue of New York. These new tracks were soon available also in Europe and were invented by Alphonse Loubat.
The new transport mode was disseminated relatively fast, and by the end of the nineteenth century and the beginning of the twentieth century several big cities worldwide featured horse-drawn tram transport.
9.1.2 The transition period from the horse-drawn tram to electrification
Mechanical systems developed rapidly, beginning with the steam-powered systems in 1873 and continuing with the electric trams after 1881 when Siemens presented the first electric powered vehicle at the International Electricity Exhibition in Paris.
The steam-powered tram appeared in Paris in 1878. The first prototype of an electric tram was developed by the Russian engineer Fyodor Pirotsky, who converted a horse-drawn tram into an electric tram. His invention was trialed in St. Petersburg, Russia, in 1880. In 1881, Werner von Siemens opened its first electric tram line in the world at Lichterfelde near Berlin.
In 1883, Magnus Volk constructed an Electric Railway (Volk's Electric Railway) along the east coast in Brighton, England. This two kilometers line remains in service until today and is the world's oldest electric tram which is still functional.
The first major electrical system in Europe operated in Budapest since 1887.
Parallel advances took place during the same period in the United States - where Frank Sprague contributed to the invention of an electricity collection system using overhead wires. At the end of 1887, with the aid of this system, Sprague successfully installed the first large-scale electric train system in Richmond, Virginia (Richmond Union Passenger Railway).
Horse-drawn trams are still in operation in the Isle of Man, in the Bay Horse Tramway network, which was built in 1876. Similarly, Victor Harbor Horse Drawn Tram, which was constructed in 1894, is in operation in Adelaide, Australia. New horse-drawn tram systems were created at the Hokkaido Museum in Japan, and at Disneyland.
9.1.3 The development of electric trams
It was not until 1914, that all the tramway networks in the world became electric.
Electrification was technically perfected, and by the early 1930s the electric tram has been the main means of urban transport worldwide.
Table 11 Classification of tramway systems per continent and per type (2014 data)
9.1.4 The period of dismantling of tram networks
The emergence of the private car and improvements in the level of service provided by urban buses resulted in the rapid disappearance of the tram network in most Western and Asian countries by the end of 1950. In Paris, trams were abolished in 1938. In 1949 in the United States, only 10 cities maintained tram lines.
The oldest system among all, namely the Swansea and Mumbles Railway, was bought by the South Wales Transport Company, which operated a bus fleet in the region, and it was eventually abolished in 1960.
The tram networks are no longer maintained or upgraded. As a result, the tram is discredited in the eyes of the passengers. Consequently, tram lines were slowly replaced by bus lines.
9.1.5 Restoration and reintegration of tramway systems
The situation began to change in favor of the tram around the mid-1980s. The 1990s marks the renaissance of trams worldwide. New modern vehicles were constructed. Their difference when compared with the old ones is such that it can be said that they constituted a brand new urban transport mode. The modern trams are longer and more comfortable, they move almost noiselessly and are much faster, they have a modern design, and traction and braking are controlled electronically.
Nantes and Grenoble in France became the pioneer cities in the construction of modern tram systems. Their new systems were launched in 1985 and 1988, respectively.
The renaissance of the tram in North America began in 1978, when Edmonton, a city in Canada, acquired the German U2 system constructed by Siemens-Duewag. Three years later, the cities of Calgary, Alberta and San Diego followed.
9.2 Present situation
All the data recorded and analyzed in what follows, relate to the year 2014. The raw data were obtained per country, per city and per line, from various available sources and cross checked. Afterwards, they were further manipulated for the needs of this section. The data relate to railway systems which meet the technical and operational characteristics that are attributed to trams. They serve only the city's urban space, and by majority they are referred to by one of the following terms: tram, tramway, streetcar, strassenbahn, stadtbahn. In some cases, they are referred to by the terms metro leger, light rail, but they have the characteristics of the tram.
A total of 448 tramway networks in operation are recorded worldwide ( Table 11), while 27 more are under construction.
Europe is the continent with the most tramway systems, which is approximately 72% compared to the other continents (there are 322 networks in operation in Europe alone). Most tramway networks are located in Russia (65 networks), followed by Germany (61 networks) and the United States (47 networks).
Most tourist networks are found in America (33 networks), while Europe has the most long-distance networks (17 tram-train networks).
Table 12 presents the tram-train systems classified per continent, country and city.
Table 12 Classification of tram-train systems per continent, country and city
Table 13 Urban trams per continent and per type of historical evolution
The countries which feature the largest number of tram-train networks are Germany (7) and France (5).
Out of 27 networks that are under construction, six are tram-trains.
Table 13 presents the urban tramway systems classified by continent and type of historical evolution as defined in paragraph 4.25.
The above data provide a rough illustration of the evolution in the construction of urban tram systems. That is, 68.3% of systems were built before 1980 and 31.7% have been built since 1980.
Urban tram systems that were built relatively recently, namely trams of categories 1 and 2, correspond to 32% (116) of the total number of urban tram systems (369).
In a total of 369 urban trams, 187 (51%) are in operation in just five countries. The graph presented in FIG. 38 shows the percentage distribution of urban trams of categories 1 and 2 in relation to the floor height.
As can be clearly seen from FIG. 38, low-floor trams have prevailed, as 79% of all recently constructed tramway networks have low-flow vehicle fleets.
Finally, 85% of modern urban tram systems feature standard track gauge. For 15% of networks that feature a different gauge, the most common values of the gauge are 1,524 and 1,000 mm.
Out of the 27 networks that are under construction, only one has a gauge other than the standard gauge (tram-train in the Spanish city of Cadiz, 1,668 mm).
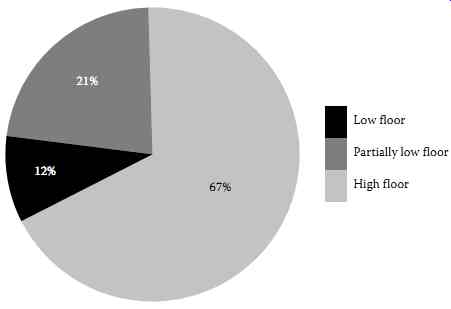
FIG. 38 Percentage distribution of urban trams of categories 1 and
2 in relation to the floor height.
Prev. | Next
Top of Page | Article Index