(cont. from part 1)
4. CLASSIFICATION OF RAILWAY SYSTEMS
Railway systems can be classified in to many ways. This section defines the term 'speed' in railway engineering and attempts a classification of railway systems based on their functionality, the track gauge and the traffic. This classification is consistent with the structure of this guide and is aimed at facilitating the reader.
4.1 Speed in railway engineering: Design and operational considerations
The term 'speed' in a railway context may be defined in various ways, depending on the technical and/or operational context being considered. The following definitions are commonly used:
• Track design speed (Vd), which is defined as the speed the track alignment and corresponding railway infrastructure as a whole (superstructure, substructure, civil engineering structures, systems/premises) has been designed and constructed for.
Thus, it is regarded as the maximum speed a train can safely and comfortably operate at on a given track. This speed is not related to any operational or track capacity constraints.
• Permissible track speed (Vmaxtr), which is defined as the maximum speed that may be developed on a railway track section at the time a given rolling stock is commissioned.
This speed is determined by the Infrastructure Manager of a railway network taking in consideration the track ride quality as well as other performance aspects at the moment. The permissible track speed is directly related to the maintenance level of the track and the line as a whole.
• Maximum running speed (Vmax), which is defined as the maximum speed developed by a particular train type on a given line, while performing a scheduled route. This speed may either refer to a small segment of the line, or it may develop at the biggest part of the route.
• Operating speed (Vop), which is defined as the speed that is developed at the biggest part of the route (e.g., at 2/3 of the route length) by a particular train type while per forming a scheduled route. Passage speed (Vp), which is defined as the constant speed with which a train passes from a particular, characteristic segment of the line which is of small length (e.g., passing through a tunnel, passing through stations, etc.).
• Instant speed (Vt ), which is defined as the speed with which a train passes from a specific kilometric point at a specific time.
• Commercial speed (Vc), which is defined as the ratio of the length of a railway route (usually between the two terminals or between two important intermediate stations) to the time it takes to cover it, including halt times at all intermediate stations and delays. Commercial speed always refers to a particular type of train and a given route.
• Average running speed (Var), which is defined as the quotient of the length of a line segment (usually between two successive stations), to the time taken to pass this segment, considering normal traffic conditions (e.g., no unforeseen delays). The average running speed always refers to a particular train type and a given line segment.
• Rolling stock design speed (Vrs), which is defined as the maximum speed that, according to the manufacturer, can be developed by a particular type of locomotive, or with which a trailer vehicle can move, or, finally, the maximum speed that can be developed by a multiple unit of given formation taking into consideration the traction system (diesel or electric power), the hauled weight, the track geometry alignment design and considering the track to be of very good ride quality.
It should be noted that it is desirable that the track design speed (Vd) be the same on all track sections of a railway corridor.
The mathematical expressions (eqn.2) generally apply:
Var = Vmaxtr = Vd (eqn.2)
Regarding speed, the quality of the railway infrastructure is secured when
• Vmaxtr at individual track segments coincides with the track design speed Vd which, however, corresponds to a particular traction system
• The average running speed Var is nearly equal to Vmaxtr (in case this refers to a segment between two successive stations due to the train's acceleration and deceleration while starting and stopping, these two speed values cannot coincide, and in this occasion the value of Vmaxtr is greater) In regard to the combination of track and rolling stock, the design speed of the rolling stock (Vrs) must be slightly greater than Vd or at least equal to Vd.
Finally, in regard to the level of service and, more specifically, the run times, the maxi mum train running speed Vmax must be achieved for the longest part of the route.
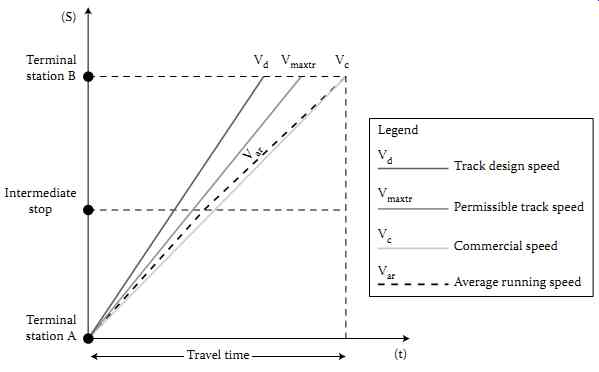
FIG. 22 illustrates the graphical representation of the speeds Vd,
Vmaxtr, Var, Vc, for a route ?? with an intermediate stop, considering
that the speeds Vd, Vmaxtr are the same for all of the route length S.
FIG. 22 Speed in railway engineering.
4.2 Classification of railway systems based on functionality
In general, the railway systems fall under the category of terrestrial transport moving along a dedicated corridor ('fixed permanent way').
Depending on the rolling system they use, these guided transport modes are distinguished into railway, aerial, road and magnetic systems ( FIG. 23).
The term 'railway means of transport' may include all transport means whose rolling sys tem involves at least one iron component (steel wheels on rails, or rubber-tired wheels on a steel guideway). In this context, this guide examines only those means of transport that have this particular characteristic in common.
The railway systems transport passengers (passenger railway systems) or goods (freight trains).
On the basis of the geographic/urban environment in which they operate, and generally on their functionality, they are separated into ( FIGs. 24 through 1.37)
• Interurban systems
• Suburban/commuter (urban rail)/regional systems
• Urban systems
• Steep gradient railway systems
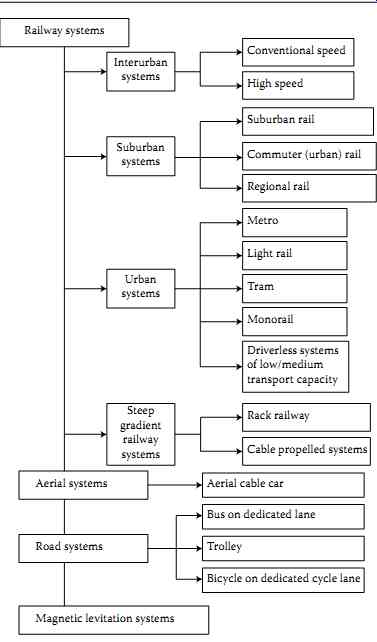
FIG. 23 Classification of guided transport modes on 'fixed permanent
way'.
The interurban railway serves trips greater than 150 km and usually links major urban centers. It comprises high-speed trains (Vmax = 200 km/h, Vc = 150 km/h) ( FIG. 24) (see Section 12) and conventional speed trains (Vmax < 200 km/h) ( FIG. 25).
The suburban railway ( FIGs. 26 and 1.27) is a railway means of transport usually running on electrified lines with characteristics adapted to commuter services within the impact limits of major urban areas (suburbs and satellite regional centers). Its range can exceed 100 km and may even reach up to 150 km. The nomenclature varies. When covering distances of 30-50 km, it is designated as an urban railway, whereas when it covers longer distances it is called sometimes 'regional' railway.
Urban railway systems include:
• The metro ( FIGs. 28 and 1.29)
• The light metro ( FIG. 30)
• The tramway ( FIG. 31)
• The monorail systems ( FIGs. 32 and 33)
• The driverless railway systems of low/medium transport capacity (FIGs. 34 and 35)
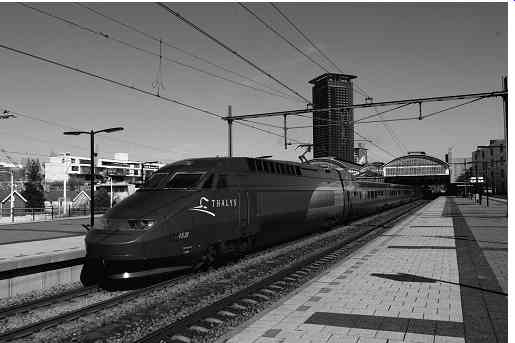
FIG. 24 High-speed interurban railway (THALYS).
FIG. 25 Conventional speed interurban train, Helsinki, Finland (hauled electric passenger train).
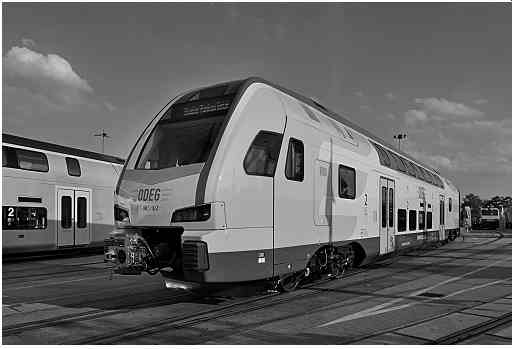
FIG. 26 Suburban railway, Berlin, Germany (double-deck electric railcar).
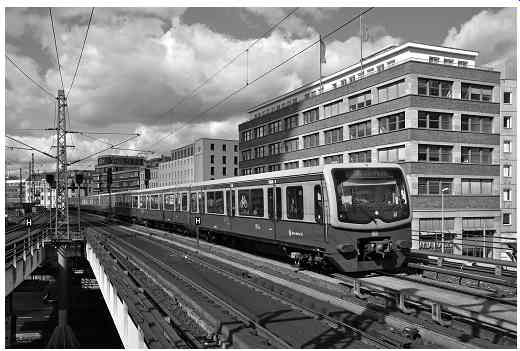
FIG. 27 Suburban railway, Berlin, Germany (electric railcar).
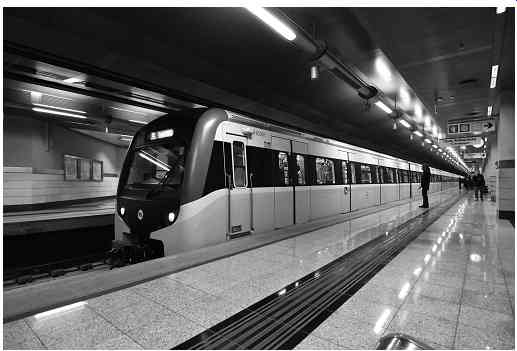
FIG. 28 Metro (with driver), Athens, Greece.
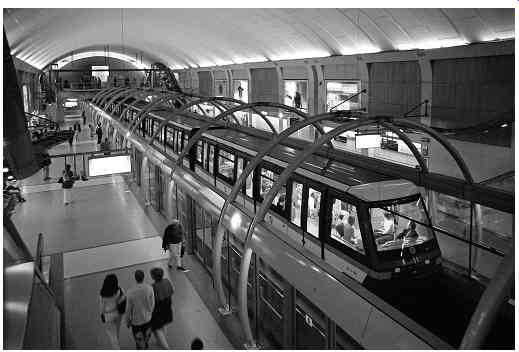
FIG. 29 Metro (driverless), Paris, France.
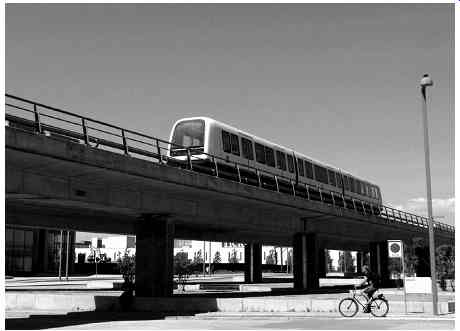
FIG. 30 Driverless light metro, Copenhagen, Denmark.
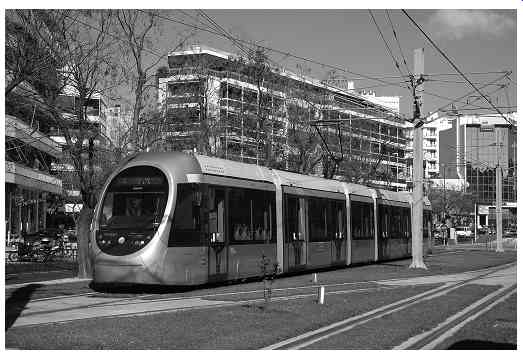
FIG. 31 Modern tramway, Athens, Greece.
FIG. 32 Monorail (suspended system), Memphis, Tennessee, USA.
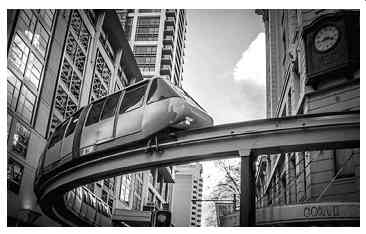
FIG. 33 Monorail (straddled system), Sao Paolo, Brazil.
Out of the above systems, the first three serve trips which are performed exclusively within a city (urban transport), whereas the two latter ones are mainly used for trips with a different character. More specifically
• In essence, metros move underground and are characterized by great transport capacity and high implementation cost.
• Trams are integrated in the road arteries of the city, using a specific track superstructure.
• The light metro is, on the basis of its construction and operation features, a system somewhere between the tram and the metro. Light metro and tram belong to the so-called 'Light Rail Transport Systems' (Light Rail Vehicles - LRV or Light Rail Transport Systems - LRTs).
The monorail moves using a system of rubber tyres (this is the most common type) on an elevated guideway comprising a single beam made of concrete or steel. It serves short distances within the urban environment and is particularly suitable for trips within recreation areas (thematic parks, zoo parks, etc.), as well as for connecting the city centre to the airport.
Finally, driverless systems of low/medium transport capacity move on an exclusive transport corridor using either single vehicles with a transport capacity of 3-25 persons ( FIG. 34), or trains of low and medium transport capacity. They are either cable propelled (FIG. 35) or self-propelled electric systems and they belong in the category of Automated People Movers. In the urban environment, such systems may serve as feeders for heavy rail transport systems. However, they usually operate for the service of trips within airports, large hotels, casinos, congress centers and health centers, educational institutions and big companies' premises.
The 'steep gradient railway' serves small-distance connections with an important difference of altitude between the two edges of the railway line. They are separated into rack railways ( FIG. 36) and cable-propelled railway systems ( FIG. 37).

FIG. 34 Driverless self-propelled railway systems of low/medium transport
capacity.
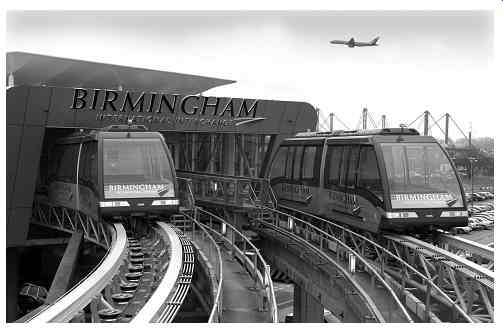
FIG. 35 Driverless cable-propelled railway systems of medium transport
capacity - Birmingham airport system, UK.
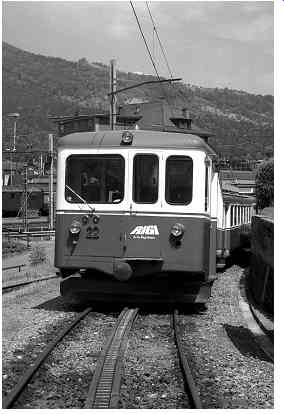
FIG. 36 Cog railway, Arth Goldau, Switzerland.
The rack (or cog) railway is mainly used to approach remote mountain developments and tourist resorts, on tracks with longitudinal slopes usually exceeding 50-70‰. Apart from the two classical rails, the cog railway superstructure includes a special toothed rack rail mounted between the conventional running rails. The wheelsets of the power vehicles are fitted with one or more cog wheels that bind in the rack rail. The required supplementary traction force is achieved through the engagement of the rack rail teeth with the locomotive pinion teeth.
Cable-propelled railway systems for steep gradients use vehicles that are hauled via cables.
On the basis of the technique that is used for their traction they are divided into funicular (non-detachable, cable-propelled vehicles for steep gradients), cable railway (detachable, cable-propelled vehicles for steep gradients), and inclined elevator.
The funicular ( FIG. 37) operates using two vehicles which move on rails with the aid of a cable; one of the vehicles is ascending while the other one is descending. The cable rolls over pulleys which are mounted on the track superstructure. The vehicles are permanently connected to both ends of the cable and start and stop simultaneously. The ascending vehicle uses the gravitational force of the descending one (counterbalance system). The system usually connects distances of less than 5 km, with constant longitudinal gradients of around 300-500‰ (max value recorded in practice: 1,200‰).
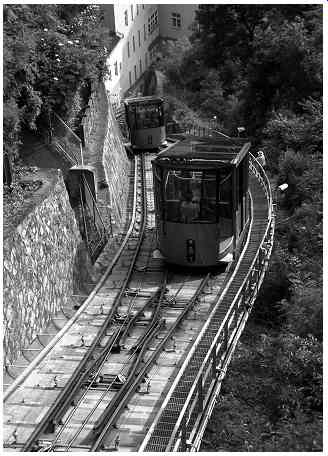
FIG. 37 Funicular, Graz, Austria.
The cable railway also uses vehicles which run on conventional rails, using a cable which moves constantly and at a constant speed. The difference between the two systems lies in the fact that for the cable railway the vehicles are not permanently connected to the cable.
The vehicles can stop independently, disconnecting from the cable, and may start again, reconnecting to the cable. This process may occur either automatically or manually ( San Francisco system, USA).
The inclined elevator or inclined lift or inclinator is a variant of the funicular. It operates using a single vehicle which is either winched up at the station on the top of the inclined section where the cable is wound on a winch drum, or the weight of the single vehicle is balanced by a counterweight so that the system operates as a funicular. It usually connects distances of less than 1.5 km, with constant longitudinal gradients of around 500-700‰.
This system can serve extremely steep gradients.
Freight trains, as seen in FIG. 9, are divided into the following categories:
• Conventional loads (axle load Q = 25)
• Heavy loads (axle load Q > 25)
• Hazardous goods
• Transport of small parcels
4.3 Classification of railway systems based on track gauge
The track gauge (2e) is the distance between the inner edges of the heads of the two rails measured at 14-16 mm below the rolling surface plane ( FIG. 38).
The track gauge is not the same in all countries. In many countries it varies from region to region.
On the basis of the gauge, railway lines are divided in to five categories:
• Standard tracks or standard track gauge: This category mainly comprises the 1435 mm gauge. This distance (4 feet and 8 inches) was established by the British engineer George Stephenson (1781-1848).
• Broad tracks or broad track gauge: This category mainly comprises the following gauges: 1,520/1,524 mm (former Soviet countries), 1,600 mm (Irish gauge) and 1,665 mm, 1,667 mm.
• Meter tracks or meter track gauge: This category mainly comprises the following gauges: 914 mm, 950 mm, 1,000 mm (meter), 1,050 mm, 1,067 mm ( Cape gauge).
• Narrow tracks or narrow track gauge: This category comprises gauges from 600 to 900 mm and mainly 600 mm (Decauville), 700 mm, 750 mm, 760 mm (Bosnian gauge). These gauges are usually used for secondary lines (industrial area, factory, mine service lines). Meter and narrow tracks are also termed as small gauge tracks.
• Mixed gauge tracks: This category comprises tracks on which trains of different gauge category may run simultaneously.
Regardless from the track gauge category, the distance between the rails remains constant throughout the network length apart from the curved alignment sections with small curvature radii (Rc < 150-200 m), where in many cases, a widening of the track gauge is permitted to facilitate the inscription of vehicle wheelsets (gauge widening).
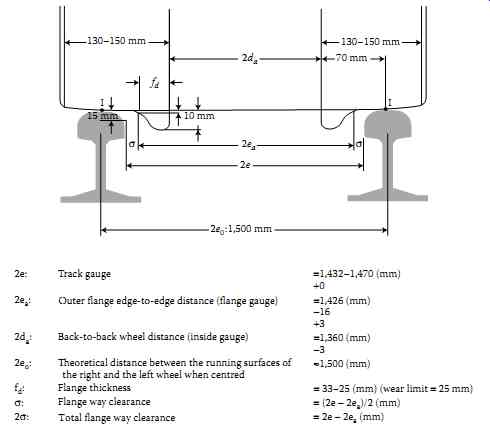
FIG. 38 illustrates the layout of the rails and the wheels that roll
on them, for the case of standard track gauge (indicatively).
The mathematical equation (eqn.3) applies
2s = 2e - (2da + 2fd) (eqn.3)
======
FIG. 38 Railway wheels on rails-track of standard gauge-geometrical and constructional dimensions (track-centered wheelset).
======
4.4 Classification of railway systems based on traffic
The number and percentage of each category of rolling stock (railway traffic composition) using a specific railway infrastructure can be directly used in classifying railway systems.
On the basis of their traffic, railway network/corridors can be classified in five categories as follows:
1. Exclusively used by freight trains (freight-dedicated network/corridor)
2. Mainly used by freight trains
3. Network/corridor with mixed traffic operation
4. Mainly used by passenger trains
5. Exclusively used by passenger trains (passenger-dedicated network/corridor)
The exact limits that are used in order to distinguish networks/corridors based on their traffic composition are set in Section 17.
The term 'mixed traffic operation' commonly describes the routing of both freight and passenger trains on the same track.
The term 'exclusively used or dedicated' describes the exclusive routing of either passenger or freight trains on the track.
5. THE CAPABILITIES OF THE RAILWAY SYSTEM
5.1 Advantages and disadvantages of the railway
TABLE 1 presents the advantages and disadvantages of the railway compared with other means of transportation.
Some of the advantages/disadvantages of the railway system are discussed below, while Section 5.3 presents a comparison between the level of service provided by the railway and comparison with that of other competing transportation systems.
• High transportation capacity: The steel-on-steel contact significantly reduces the specific rolling resistance (15 N/t for the railway, 150 N/t for a tourist coach, 300 N/t for a road truck) (Metzler, 1981).
A locomotive can therefore pull a greater load than a road vehicle by applying the same tractive effort. Also, a train is formed of many vehicles, thus allowing it to increase or alter its transporting capacity according to the demand.
For example, in order to transport 700 passengers, a train of length between 280 and 300 m is needed. For the same number of passengers to be transported by road it would require...
• 15 coaches with 44 seats covering a length of road of 1,050 m.
• 170 private cars with 4 seats in each, covering a road distance of 11,900 m including any safety distance.
• High-speed travel:
Nowadays, technical advances in the areas of rolling stock and the track allow a train to move safely on a straight track of good rolling conditions at running speeds Vmax > 300 km/h (since 2009, Vmax = 350 km/h in China. However, following the fatal rail accident which occurred on the Ningbo-Wenzhou line on the 23 July 2011, the maximum running speed of high-speed trains was initially limited to Vmax = 300 km/h. However, there is potential to allow an increase in the maximum running speed to its initial value).
========
TABLE 1 Advantages and disadvantages of the railway
[
Advantages:
• High transportation capacity
• High-speed travel
• Travel safety
• Rail services regardless of weather conditions (regularity of services)
• Environmentally friendly transport
• One degree of freedom (automation of many operations)
• Passenger comfort/relaxed state of mind
• Small land take (right-of-way)
]
[
Disadvantages:
• Increased requirements in track geometry design (horizontal, longitudinal alignment)
• Low wheel-rail adhesion coefficient
• One degree of freedom (no door-to-door services)
• Hard (noisy) rolling
• Low network density
]
=========
=========
TABLE 2 Railways - characteristic speeds
[ Characteristic speeds:
Rolling stock design speed (Vrs) Average running speed between successive stops (Var)
Maximum running speed (Vmax) Track design speed (Vd) Speed record
]
[
Maximum value (km/h) 380 (CRH380D & DL ZEFIRO)
283.4 ( China) 320 ( Europe, Japan), 300(350) ( China) 400 574.8 ( France)
]
=========
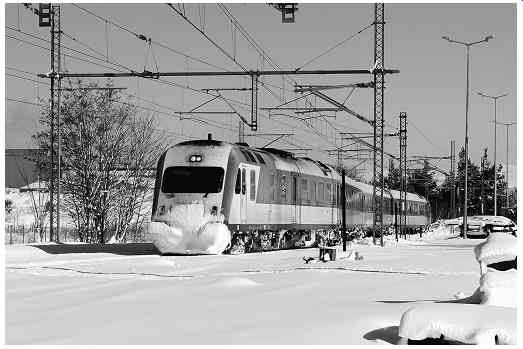
FIG. 39 Rail services regardless of weather conditions.
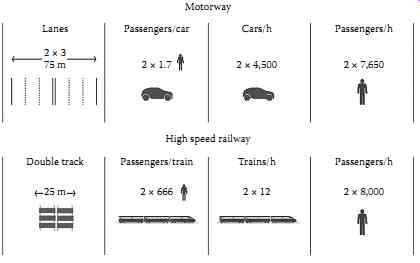
FIG. 40 Comparison between occupied space (right-of-way) of a double
standard gauge track and a highway for approximately the same transport
capacity.
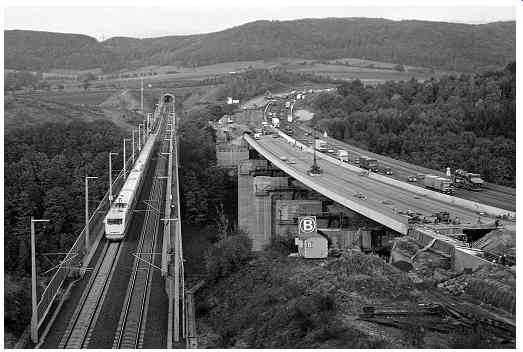
FIG. 41 Right-of-way for a double railway track and for a highway (2
× 3), Mundener bridge, Koln Frankfurt, Germany.
China holds the record for the fastest average running speed (between two successive intermediate stops) at Var = 283.4 km/h, based on 2015 data , while France retains the world speed record with a test train (574.8 km/h) recorded on April 3, 2007.
With regard to passenger transportation, trains in many countries move on conventional lines at running speeds in excess of 160 km/h, while there are 21 countries glob ally operating high-speed lines (Vmax = 200 km/h, and Var = 150 km/h, see Section 12).
Finally, there are 11 countries worldwide that have lines operating with Vmax = 250 km/h and Var = 200 km/h.
As far as freight transport is concerned, numerous countries operate trains moving between 100 and 120 km/h. TABLE 2 shows values for characteristic speeds which apply today for the railway globally.
• Rail services regardless of weather conditions ( FIG. 39): Safety in train operation and train movement is generally not affected by extreme weather conditions (fog, snow, ice, strong winds), and cancellation of scheduled services due to weather conditions is seldom needed. Given this fact, the railway ensures regularity in its services, a quality of great importance to its users.
• Passenger comfort/relaxed state of mind: Provided that it offers a satisfactory level of service, the railway is generally viewed in a positive light in comparison with road and air transport, as the passenger
• Has greater comfort in terms of space when the train is moving; he/she can move about more, visit the restaurant car, work on the train. It should be noted that for high-speed trains there is no obligation for passengers to wear a seatbelt.
• Can enjoy the view throughout the whole journey.
• Is transported 'on terra firma' without having to drive him/herself, which psycho logically is more comforting.
• Occupies a small space: A double standard gauge track occupies a space of about 1/3 of that of a two-way highway with three lanes per direction ( FIGs. 40 and 41). Indicatively, for 1 km of high-speed railway line, 3.2 hectares of land are needed, while for the same amount of highway length 9.3 hectares of land are needed.
• Increased requirements in track geometry alignment: The design of a railway line is more demanding both in terms of the horizontal alignment and in terms of its longitudinal alignment compared with that of a road. Regarding its horizontal plane, the curve radii for the interurban and suburban railway must be greater than Rc = 250- 300 m in 'open' track sections (outside the area of stations).
In terms of its longitudinal alignment, the effective exploitation of a railway net work sets the gradients for the interurban and suburban railway at imax = 3%-4% with usual gradients at less than 2%-2.5%. In the case of road-works, the corresponding values lie between 8% and 10%.
TABLE 3 shows the characteristic gradient values for various means of transport and networks.
• Low wheel-rail adhesion coefficient: In railways, the contact surface between the rail and the wheel features a small adhesion coefficient due to the nature of the materials in contact (steel on steel). In road transport, this coefficient is approximately three times greater.
The small adhesion coefficient acts negatively on two basic operations: braking and starting the train. The greatest braking distance required to stop the train automatically sets a maximum speed limit as well as a maximum longitudinal gradient for the railway.
Furthermore, the wear on the wheel-rail contact surface created by the friction between the wheel and the brakes is a major financial burden for the maintenance and operation of a railway network.
As a result of the lower adhesion coefficient the necessary braking length for the same speed and weight is greater for a train than it is for a private car.
TABLE 4 presents the braking distance for various categories of transport. TABLE 5 presents the proportional relations.
• Hard (noisy) rolling: The hard steel-on-steel rolling, which characterizes the wheel- rail system, increases rolling noise and vibrations, resulting in the requirement for mitigation measures, regarding both the source of the noise (rolling stock - track) and the receptor.
• Low network density: It is possible at specific points of the railway network to con verge, cross, split and join tracks. The above conditions are achieved through the various switches and crossings configurations provided as part of the superstructure along the section in question.
However, it is both technically difficult (if not impossible) and economically unprofitable to develop a rail network that has the same level of density as a road network.
============
TABLE 3 Characteristic values of longitudinal gradients for different means of transport and network cases
[
Means of transport/network
Road transport Cog railway Cable-propelled systems (funicular) Tramway Metro Monorail High-speed network Conventional interurban/suburban train
]
[
Longitudinal gradient
8% (a road category, V = 60 km/h) 15%-20% (maximum values) 5%-48% 9%-120% 7%-8% (maximum values) 5% (maximum value) 10% (maximum value, 20% gradient is used in two cases) (see Section 6) 3.5%-4.0% (maximum values) 3%-4% (maximum values)
]
=============
=============
TABLE 4 Braking distance for different means of transport
[
Transport means
Boeing 747, landing speed V = 200 km/h Road vehicle, V = 120 km/h
Dry road surface
Wet road surface Lorry, V = 80 km/h
Dry road surface
Wet road surface Freight train, V = 80 km/h TGV (PSE), V = 270 km/h TGV A, V = 300 km/h
]
[ Braking distance
1,500 m 95 m 142.5 m 60 m 90 m 700 m (emergency brake) 3,000 m (emergency brake) 3,200-3,500 m (emergency brake)
]
==============
5.2 Comparison of the characteristics of railway systems
TABLE 6 presents the basic technical and operational characteristics of passenger railway transportation systems. These characteristics are analyzed in depth in the respective guide sections devoted to each system.
=========
TABLE 5 Comparative braking distances among different modes
[
Airplane/ high-speed train
Road vehicle/ conventional-speed train
Truck/freight train
]
[
Braking distance ratios
1:2 1:10 1:10
]
=========
TABLE 6 Main technical and operational characteristics of passenger railway transport systems
5.3 Comparison of the capabilities of different transportation systems
The advantages and disadvantages of each transport system are usually compared by quantifying the parameters of one system and contrasting them with the corresponding ones of the other modes. The difficulties inherent to such an approach are numerous, since (a) one must compare competitive modes (with similar functionality) in order for the results to be comparable, (b) in the literature, one comes across statistical data comparing the transport systems at various levels with regard to the geographical presence of the means at a global level, at a continental level, within a country or a group of countries (e.g., EU member states) and so on (c) For the same evaluation indicator, there is a wide variation in the values com pared depending on the literature; this shortcoming, which is particularly strong, requires cross-checking data from numerous and various sources in order for the final results to be as reliable as possible.
Within this framework the two cases below are compared:
Case 1: Long-distance trips (S = 500-1,500 km). Airplanes and high-speed trains are compared.
Case 2: Urban trips. Metro, tram, urban bus and private car are compared.
The comparison does not include parameters related to the natural environment.
5.3.1 Comparison of air and high-speed train transport
In order to compare high-speed trains with airplanes, eight specific connections in Europe served by both means of transportation (Rome-Naples, Rome-Florence, Madrid- Barcelona, Madrid-Seville, London-Paris, Amsterdam-Paris, Brussels-Amsterdam, Paris-Lyon) have been taken into consideration. These routes either concern domestic connections or international connections. The routes concern the 2009-2010 period.
After analyzing the data, the following may be reasonably concluded:
• Regarding travel times, airplane is the fastest mode (ratio 1:1.7 for short distances (250 km), 1:3 for long distances (500 km)).
• Regarding transfer times, the airplane prevails only for long and very long distances.
• The ratio of number of daily services between the airplane and the high-speed train is 1:4.
• Travelling is clearly less expensive by train than it is by airplane.
• Transport capacity is calculated by multiplying the number of journeys carried out daily in the eight connections examined by the number of passengers who can be carried every day by each mode. Specifically regarding air travel, an average airplane load is equal to 247 passengers. For connections over 400 km, the conclusion to be drawn is that the transport capacity ratio between airplane and high-speed train is 1:3.
5.3.2 Comparison of urban systems
TABLE 7 shows the comparison between different urban transport systems, in terms of transportation capacity, commercial speed, fares, frequency and space occupied.
6. HISTORICAL OVERVIEW OF THE RAILWAY AND FUTURE PERSPECTIVES
The development of the railway is directly related to the use of steam as a source of energy and the exploitation of coal and iron mines. TABLE 8 shows the mile stones in the history of railways.
TABLE 7 Comparison of urban transport systems
The year 1825 is considered to be the starting point in the history of railway, and George Stephenson, an English engineer, is considered as its pioneering figure.
The railway is perhaps the only technology that during its course of development reached an early peak, then found itself being in question and during the last decade it not only man aged to rise again but also to be at the cutting edge of technology in many countries.
In short, the railway dominated terrestrial transportation for over 100 years (1830-1950). During this period, it made an enormous contribution to transportation and civilization.
The railway is considered to be the mode of transport that laid down the foundations for inland development on all continents. If it were not for the railway, the coastal towns would have become powerful, as they would be the only ones able to support the growing demand for transport of goods by using the basic means of mass transportation, that is, ships. The 1950s saw the start of the struggle between the railway on the one hand and the airplane and car on the other, a struggle which was to intensify from the mid-1960s onwards. At the dawn of the 1970s, not only had the railway begun to lose a worrying amount of ground in terms of its share of the transport market, but also railway organizations begun to suffer financially (loans, deficits) and to be significantly dependent on state budgets, having problematical cross-border services.
=======
TABLE 8 Important milestones in the history of the railway
1800 Discovery of the steam engine (Watt)
1822 Operation of the first factory to construct steam engines (Stephenson, Newcastle, England)
1825 First commercial steam-powered railway journey (Stockton-Darlington line, England)
1830 Operation of first passenger steam-powered railway (Liverpool-Manchester)
1830 First flat-bottom rails (Stevens, USA)
1858 First steel wheels ( Bessemer)
1879 Unveiling of first electric locomotive (Siemens-Halske, Germany)
1938 First appearance of diesel traction
1964 Operation of first high-speed train (Vmax = 210 km/h, Japan, Tokyo-Osaka line)
1981 Operation of first high-speed train in Europe (Vmax = 260 km/h, France, TGV PSE)
1989 Operation of speed train 300 km/h (France, TGV-A)
1990 First conventional train to achieve a speed in excess of 500 km/h, (515.3 km/h, France)
2007 The most recent record speed for a conventional train (574.8 km/h, France)
2009 Operation of super-fast trains Vmax = 350 km/h (China)
=====
According to the European Union's institutions that are responsible for the drawing up and implementation of transport policies, 'competition' has been the solution to overcome the economic impasse afflicting the rail sector in recent years. For this purpose, important amounts were and are still being spent for the construction of new railway infrastructures and modern rolling stock, the research for increasing running speeds was intensified and crowned with success, whereas significant efforts were made to improve the services offered in both freight and passenger transport.
In parallel, while maintaining all its intrinsic advantages (safety, great transport capacity, environmental friendliness, etc.), rail transport had to try to operate with more flexible organizational structures, and the monopoly had to be lifted.
Within this framework, the European Commission published a series of directives calling for the revitalization of the railway sector and the increase of its competitiveness.
The first attempt to draw up railway legislation was made in 1991 with the adoption of Directive 91/440 by the Council of Ministers. This Directive, concerning the development of the railway in the community, is the first attempt to open up railway transportation to competition. For the first time it introduced the right of free access both for international railway consortiums and companies carrying out combined transportation to the rail infrastructure. The provisions of the Directive also imposed the accounting separation between infrastructure activities and operation activities.
Since 2010, the entire rail services within the European Community Railway Network are open.
Over the last 30 years, the improvement in the quality of life in the large cities, the dramatic rise in road and airport congestion, the intensification of air and noise pollution, as well as the continuing energy crisis, have all created a massive ecological issue. Thus, the railway has made a comeback since it is an ecologically friendly mode of transport, and has become more up-to-date, and can move at very high speeds. The use of rail transportation is judged more and more to be imperative, both for movement within urban and suburban environments, and also in order to serve the needs for long-distance traveling.
Prev. | Next
Top of Page | Article Index